
Your cart is empty
Start shopping to add items to your cart
A Data-Driven Look at Who Votes, Who Doesn't, and Why Midterms Matter More Than You Think
Jordan Lee
Conservative Contributor
Here's a number that should keep you up at night: in a typical U.S. midterm election, about 40% of eligible voters show up. Six in 10 stay home. In some state and local elections, it's under 20%. The people who decide who runs your schools, your courts, your state, and often your congressional district are a small, self-selecting minority.
This isn't a glitch. It's a pattern that goes back more than a century. And understanding the history of midterm turnout is the first step to fixing it. Let's walk through the data.
Since 1900, U.S. presidential election turnout has averaged about 60% of the voting-eligible population. Midterm turnout has averaged about 40%. That 20-point gap is not a recent phenomenon — it's been remarkably stable for over a hundred years.
Here's the rough trajectory:
• 2018 midterms: 50% turnout — the highest midterm turnout since 1914. Driven by partisan polarization and high-profile Senate races.
• 2022 midterms: ~46% turnout — the second-highest in a century, despite pandemic-era concerns.
• 2014 midterms: 36.7% turnout — the lowest in 70 years.
• 2010 midterms: 41.8% turnout — the Tea Party wave.
• 2006 midterms: 41.3% turnout — a wave election that flipped both chambers.
• 1990s-2000s: Turnout hovered in the high 30s to low 40s.
• 1960s: Turnout was higher — averaging around 45-48% — partly because the Voting Rights Act of 1965 expanded access and the era was politically volatile.
The pattern: midterm turnout dipped through the late 20th century, bottomed out around 2014, and has rebounded in the last two cycles. But even the "high" recent midterms (50% in 2018) still mean half of eligible voters stayed home.
There's no single reason — it's a combination of factors, each compounding the others:
1. Less media coverage and campaign spending. Presidential races dominate the news for 18 months. Midterm races, especially down-ballot, get a fraction of the attention. If you don't know an election is happening, you don't vote in it.
2. Fewer competitive races. Most House districts are drawn to be safe for one party. If your district is "decided" before Election Day, you're less motivated to show up. Gerrymandering depresses turnout.
3. Voting is harder than it should be. Registration deadlines, polling place closures, ID laws, and limited early voting windows all create friction. People who would vote if it were easy don't vote when it's hard.
4. Midterms are a referendum on the president. The president's party typically loses seats. If voters are unhappy, the out-party shows up; if voters are content, turnout drops. This creates an erratic turnout pattern tied to national mood.
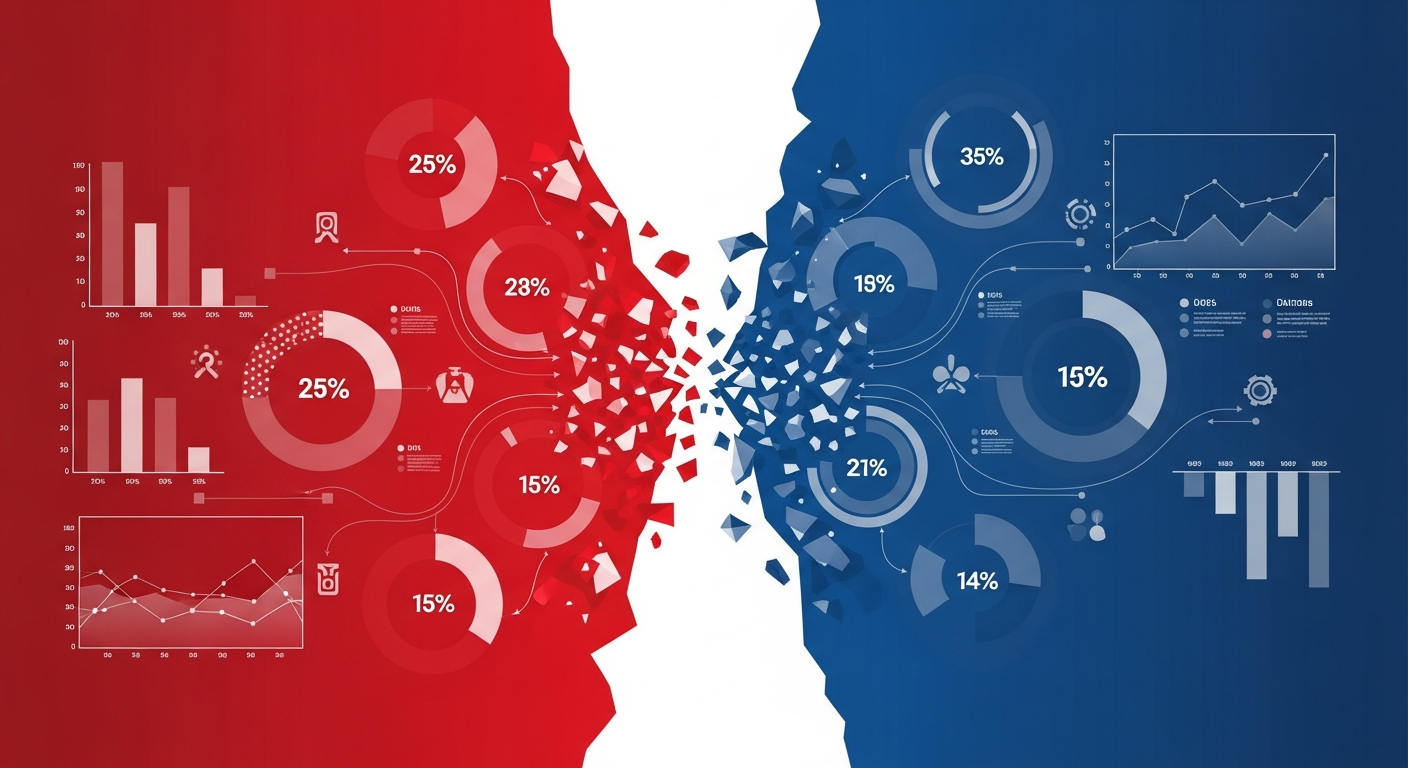
5. Demographic gaps. Older voters turn out at 60-70% in midterms. Voters under 30 turn out at 15-25%. The policies that get passed reflect that imbalance.
The most important story in midterm turnout isn't the overall number — it's the gap between who shows up and who doesn't. That gap determines policy.
By age: In 2022, voters 65+ turned out at about 65%. Voters 18-29 turned out at about 23%. That's a 42-point gap. State legislators notice. So do candidates. Policy skews toward retirees because retirees vote.
By education: College-educated voters turn out at about 55-60% in midterms. Non-college voters turn out at about 35-40%. Working-class concerns get less political attention because working-class turnout is lower.
By income: High-income voters turn out at about 60%. Low-income voters turn out at about 35%. Tax policy, social safety net design, and labor rules all reflect this gap.
By race: White voters turn out around 50% in midterms. Black and Hispanic voters turn out around 35-40%. Asian-American turnout is similar. The 2018 cycle narrowed these gaps, but they remain significant.
By geography: Rural voters turn out at higher rates than urban voters. Suburban voters are in the middle. This is one reason state policy often skews rural even in states with large cities.
The takeaway: low midterm turnout isn't random. It systematically underrepresents young, working-class, urban, and minority voters. That's not an accident of math — it's a structural bias built into who shows up.
"The people who vote in midterms are the people who get represented. Everyone else gets policy made for them by someone else's voters."
2018 was a turning point. Turnout hit 50% — the highest midterm turnout since 1914. Both parties mobilized. High-profile Senate races, the confirmation fight over the Supreme Court, and a polarized national environment drove voters to the polls. The result: a wave election that flipped the House.
2022 was nearly as high, at about 46%. Despite concerns about pandemic disruption and voter access, turnout held. Several states expanded mail voting and early voting. Others restricted it. Turnout stayed high anyway — but the gap between states widened.
What this tells us: turnout is not fixed. When voters feel stakes are high, they show up. When parties invest in mobilization, turnout rises. When voting access expands, more people vote. The "low midterm turnout" story is a default — not a destiny.
The clearest lever for increasing turnout is making voting easier. States that adopted all-mail elections, same-day registration, automatic registration, and extended early voting have consistently seen turnout rise.
Examples:
• Oregon adopted all-mail voting in 2000. Turnout rose from the low 40s to consistently above 60% in both midterms and presidential cycles.
• Colorado went all-mail in 2014. Turnout jumped from the high 30s to the high 50s.
• Utah went all-mail statewide and saw turnout rise by about 10 points.
• Same-day registration states (like Minnesota, Wisconsin, and Maine) consistently post above-average turnout.
Conversely, states with strict ID laws, short registration windows, and limited early voting tend to see lower turnout — especially among young and minority voters.
The lesson: access drives turnout. If your state makes voting hard, your state's turnout is lower, and your state's policy is less representative. Check your state's voting rules and advocate for the changes that would help.
Here's the paradox: the presidency gets the attention, but midterms often shape more of your daily life. Why?
State policy is mostly state-level. Criminal law, education funding, tax rates, healthcare access, abortion policy, gun law, voting rules — these are largely state decisions. The governor and state legislature you elect in a midterm will pass more laws that touch your life than the president will.
Congressional control is on the ballot every two years. The House especially. A two-year term means the House is the most responsive federal body to public mood. Flip it in a midterm, and you change the federal agenda.
Redistricting cycles are set by midterm winners. State legislators elected in 2026 will draw congressional maps in 2030. Those maps last a decade. Skipping a midterm is effectively handing the next decade's map to the people who did show up.
The judiciary is shaped by midterm elections. State supreme court justices are elected in many states. State judges handle 95% of all cases in the U.S. The judges on your state supreme court in 2030 were likely elected in a midterm.
The 2026 midterms will be decided by turnout. The margins are small. The stakes are large. If turnout follows the 2018/2022 pattern, we'll see about 46-50% of eligible voters show up. If it dips back to 2014 levels, a tiny minority will decide control of Congress, 36 governorships, and thousands of state legislative seats.
Here's what the history tells us about what moves the needle:
• Perceived stakes. When voters believe the election will change something, they show up. Communicate the stakes — our stakes guide is a good starting point.
• Voting access. Make it easy. Our state-by-state voting guide covers registration, early voting, mail ballots, and ID rules.
• Mobilization. Personal outreach works. Texting a friend, offering a ride, posting about it — these move turnout by several points per contact.
• Down-ballot engagement. People don't vote if they don't know what's on their ballot. Help them research. Point them to a sample ballot for their state.
The history of midterm turnout is the history of who chose to show up. The patterns are clear. The data is clear. The fix is also clear: vote, and get five other people to vote.
If you've never voted in a midterm, this is your year. If you vote every cycle, your job is to bring others with you. Use our registration check tool, our deadline tracker, and our voting guide to make it easy.
And if you want to support the work: donate to ShowUpOrShutUp or grab something from the shop. Every purchase funds free voter tools for all 50 states.
Midterm turnout has been stuck around 40% for a century. That's not inevitable — it's a choice. The people who show up decide the policy. The people who don't get policy made for them by someone else's voters.
The 2026 midterms are November 3. The history is clear. The stakes are high. Be part of the pattern that breaks the pattern. Show up or shut up.
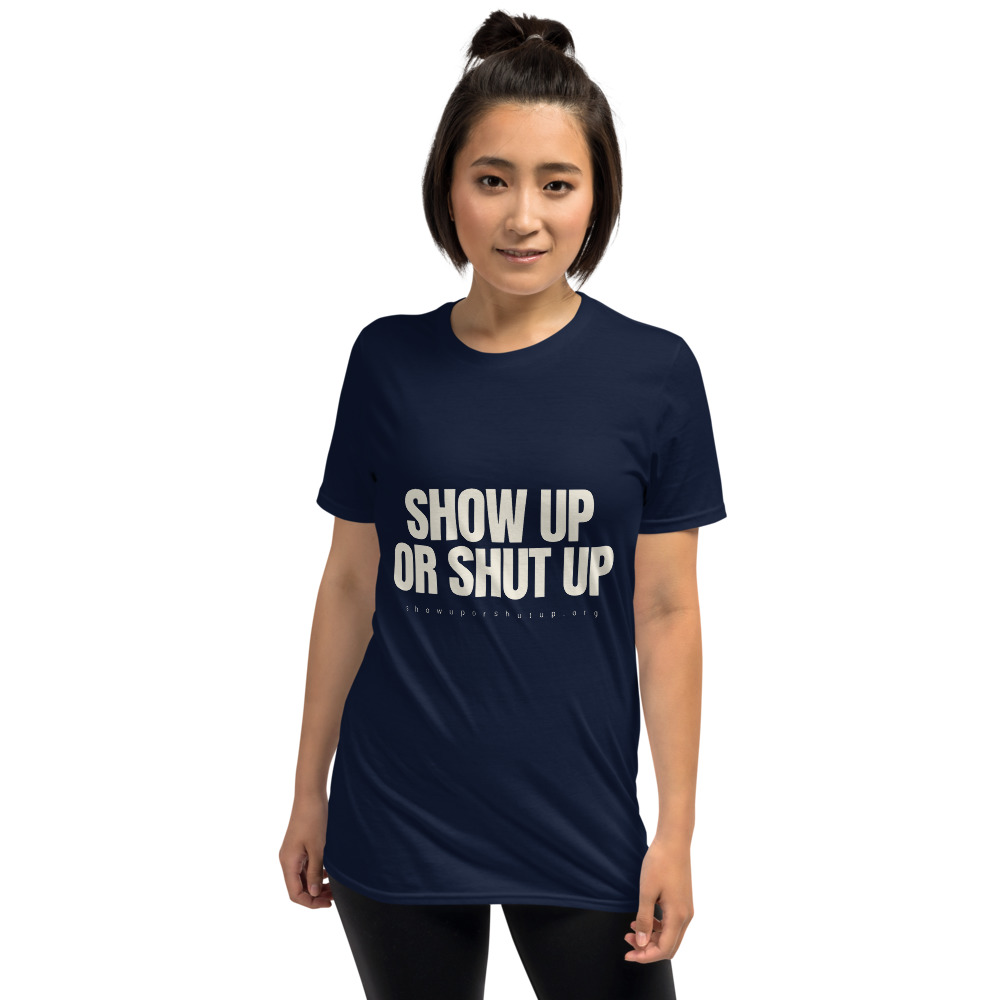
Show Up or Shut Up — the uniform for people who actually participate.
Shop the GearJoin our newsletter for weekly culture war updates, conservative commentary, and truth bombs the woke mob doesn't want you to see.
Want to go deeper? These books cover the ideas behind this article. We earn a small commission if you buy through these links — at no extra cost to you.
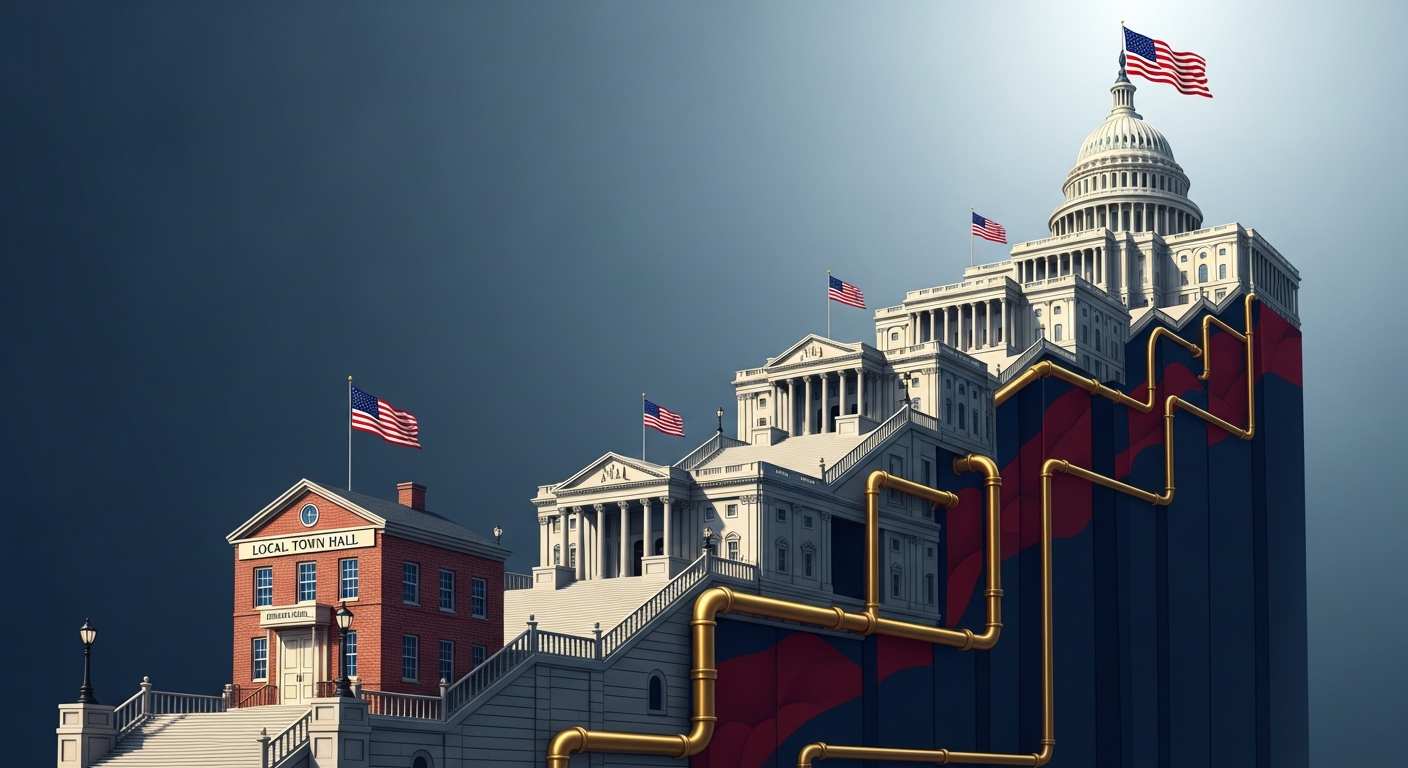
Future presidents and senators start as local officials. State governments control elections and your city council vote today shapes who runs the country.

“My vote doesn’t matter.” “Both parties are the same.” “I don’t have time.” We’ve heard every excuse. Here’s why every single one is wrong—and what you should do instead.
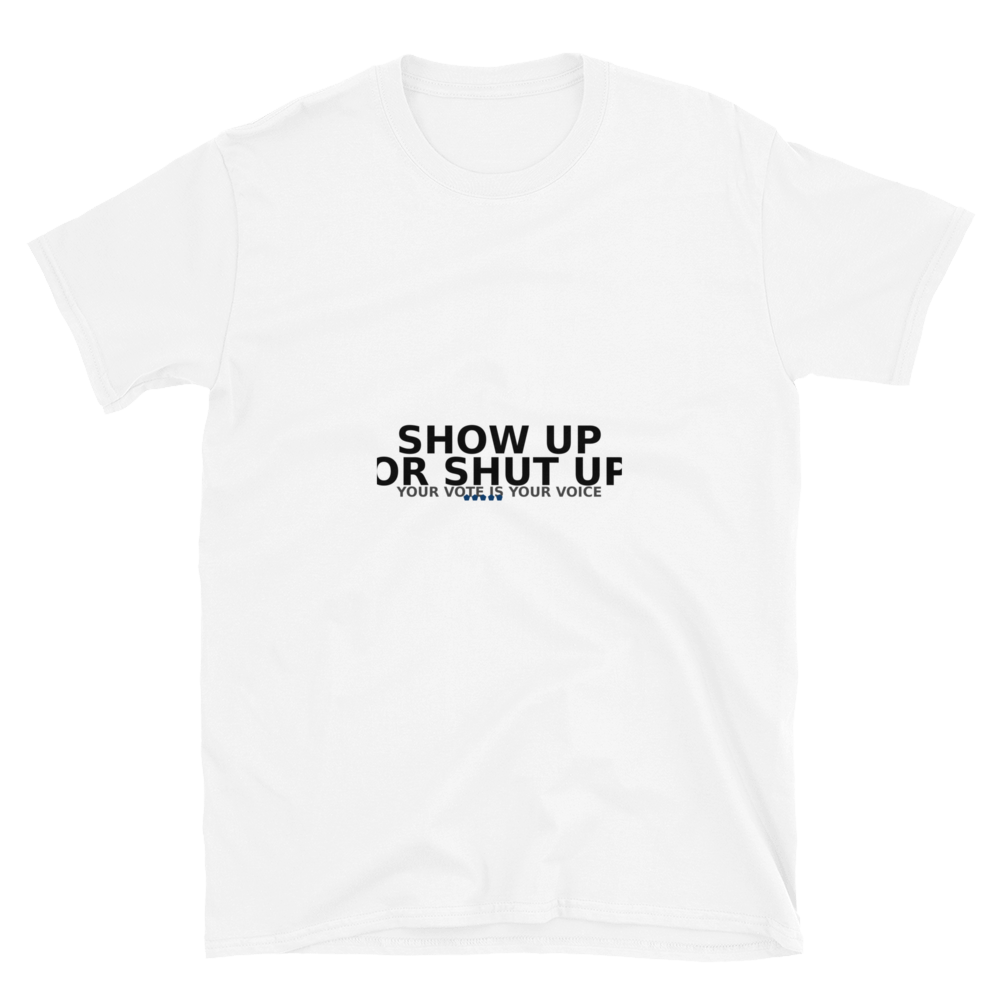
From 'I Voted' sticker packs to statement tees, here's the best voter merch for the 2026 midterm elections — and where to get it.
Make a statement at the polls. Every purchase funds more voter guides and tools like this one.
Shop the Cause →Get the exact deadlines, ID rules, and key races for the state where you\'re registered to vote.
See All 50 States